Overview
This article is intended to serve as an overview for adjusting how data is displayed in a 3D View (RenderView) in ParaView.
There are several out-of-the-box options for how 3D data is represented in ParaView, including:
- 3D Glyphs
- Outline
- Point Gaussian
- Points
- Surface
- Surface with Edges
- Volume
- Wireframe
Notes
For the purposes of this article, we will be using Paraview 5.4.1.
For installation instructions, please see the guide for CPU-based rendering or GPU-based rendering.
For help running ParaView scripts, please see the batch-execution instructions.
Manual Instructions
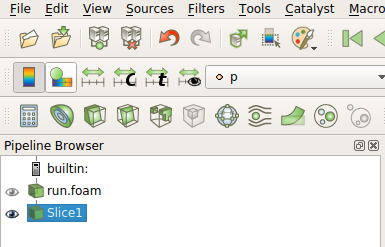
1) Begin by loading your 3D data and applying any desired Calculators or Filters. Then select your desired data object in the Pipeline Browser.
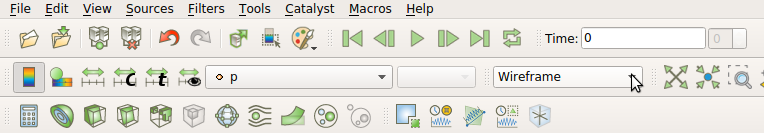
2) Next, click the representation drop-down in the Representation Toolbar at the top of the screen, and make your selection. Note that some representations may take some time to calcuate for large datasets.
Scripted Instructions
To adjust the representation of a display object, you’ll first need a variable
handle to that display object. This is most easily done when Show is called.
data_display = paraview.simple.Show(data_object, view)
Where data_object is the variable containing the data object and view is
the View object that will contain the displayed data (generally a RenderView).
Then, to change the representation, simple alter the .Representation member
variable for the display object.
data_display.Representation = 'Surface'
The out-of-the-box representations can be accessed by setting the
Representation variable to its exact string equivalent from the GUI:
data_display.Representation = '3D Glyphs'
data_display.Representation = 'Outline'
data_display.Representation = 'Point Gaussian'
data_display.Representation = 'Points'
data_display.Representation = 'Surface'
data_display.Representation = 'Surface With Edges'
data_display.Representation = 'Volume'
data_display.Representation = 'Wireframe'
Each representation has its own parameters in the “Properties” tab on the left under “Display” that can be customized, both in the GUI and programmatically.