Overview
ParaView includes a tool to capture your ParaView session commands and automatically generate Python scripts. It’s called the trace recorder. Once recorded, the Python scripts can be edited, saved and re-run as needed.
ParaView’s trace functionality is the best method for beginning a new Python script in ParaView. Simply perform the actions you wish to script manually, while recording the trace, and then make any necessary changes to the automatically generated Python script to suit your needs.
Notes
For the purposes of this article, we will be using Paraview 5.4.1.
For installation instructions, please see the guide for CPU-based rendering or GPU-based rendering.
For help running ParaView scripts, please see the batch-execution instructions.
Instructions
Recording a Python Trace
To automatically generate a Python script of your ParaView session, you must begin by recording a Python trace.
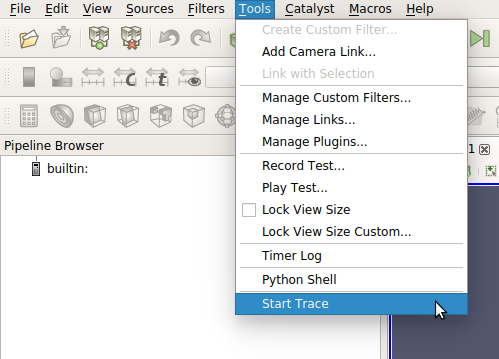
To do this, go to the top menu, and select Tools >> Start Trace.
You will then be prompted to select your trace options.
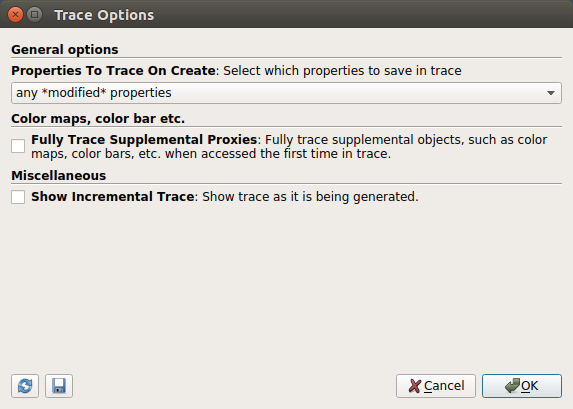
The first is “Properties To Trace On Create”. This selection will dictate which properties are saved for the Python trace. Your options are:
all properties: This properties selection will output all object properties for the ParaView session. It gives you the most information about what settings were used and the modification options you have for the Python API, but is also the most verbose selection.
any *modified* properties: This properties selection will output all properties that are changed within the ParaView session, either by the user directly, or as secondary effects. This selection is usually the best choice for starting a Python script.
only *user-modified* properties: This properties selection will only output user-modified properties.
Additionally, you can choose to enable “Fully Trace Supplemental Proxies”, which will expose the settings for all secondary session objects, like color maps, color bars, etc.
The final output, under Miscellaneous, is to “Show Incremental Trace”, which will output the Python trace results as the session actions are being performed. Otherwise, you will see the trace results at the end.
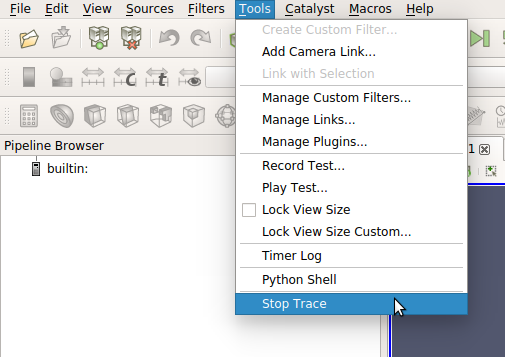
To stop your trace (and view the results), go to the top menu, and select
Tools >> Stop Trace.
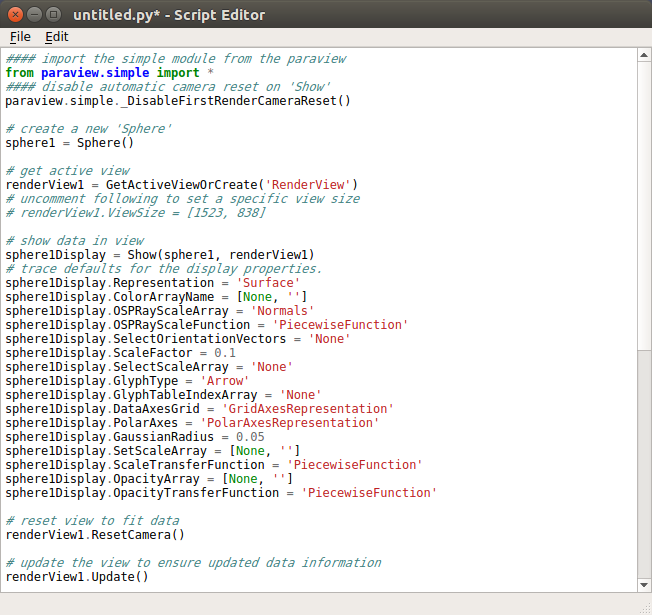
This will open the Python script editor window containing your trace results.
Editing the Script
From the script editor, you can make any necessary changes to your script, and
either save it as a script (Python file on disk), or save it as a macro. Both
options are accessed from the File menu at the top.
Running the Script
To run a Python script within an interactive ParaView session, go to the top
menu and select Tools >> Python Shell. This will load the Python Shell window.
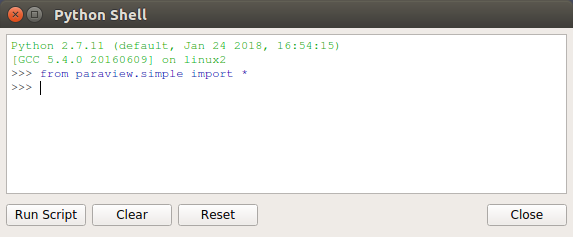
From here, you can either enter commands interactively, or click the
Run Script button at the bottom. This will open a file browser from which you
can load a script from the disk.
You can also run Python scripts in batch mode. For instructions for doing so, refer to Executing ParaView in Batch.